
Singapore Property Q1 2026: Prices Rise as Volume Crashes. Here Is Why.
Transaction volumes fell 40% in Q1 2026. Prices still grew 0.3%. Both numbers are real. Understanding why they can coexist is the most important thing any Singapore property owner or buyer needs to grasp right now.
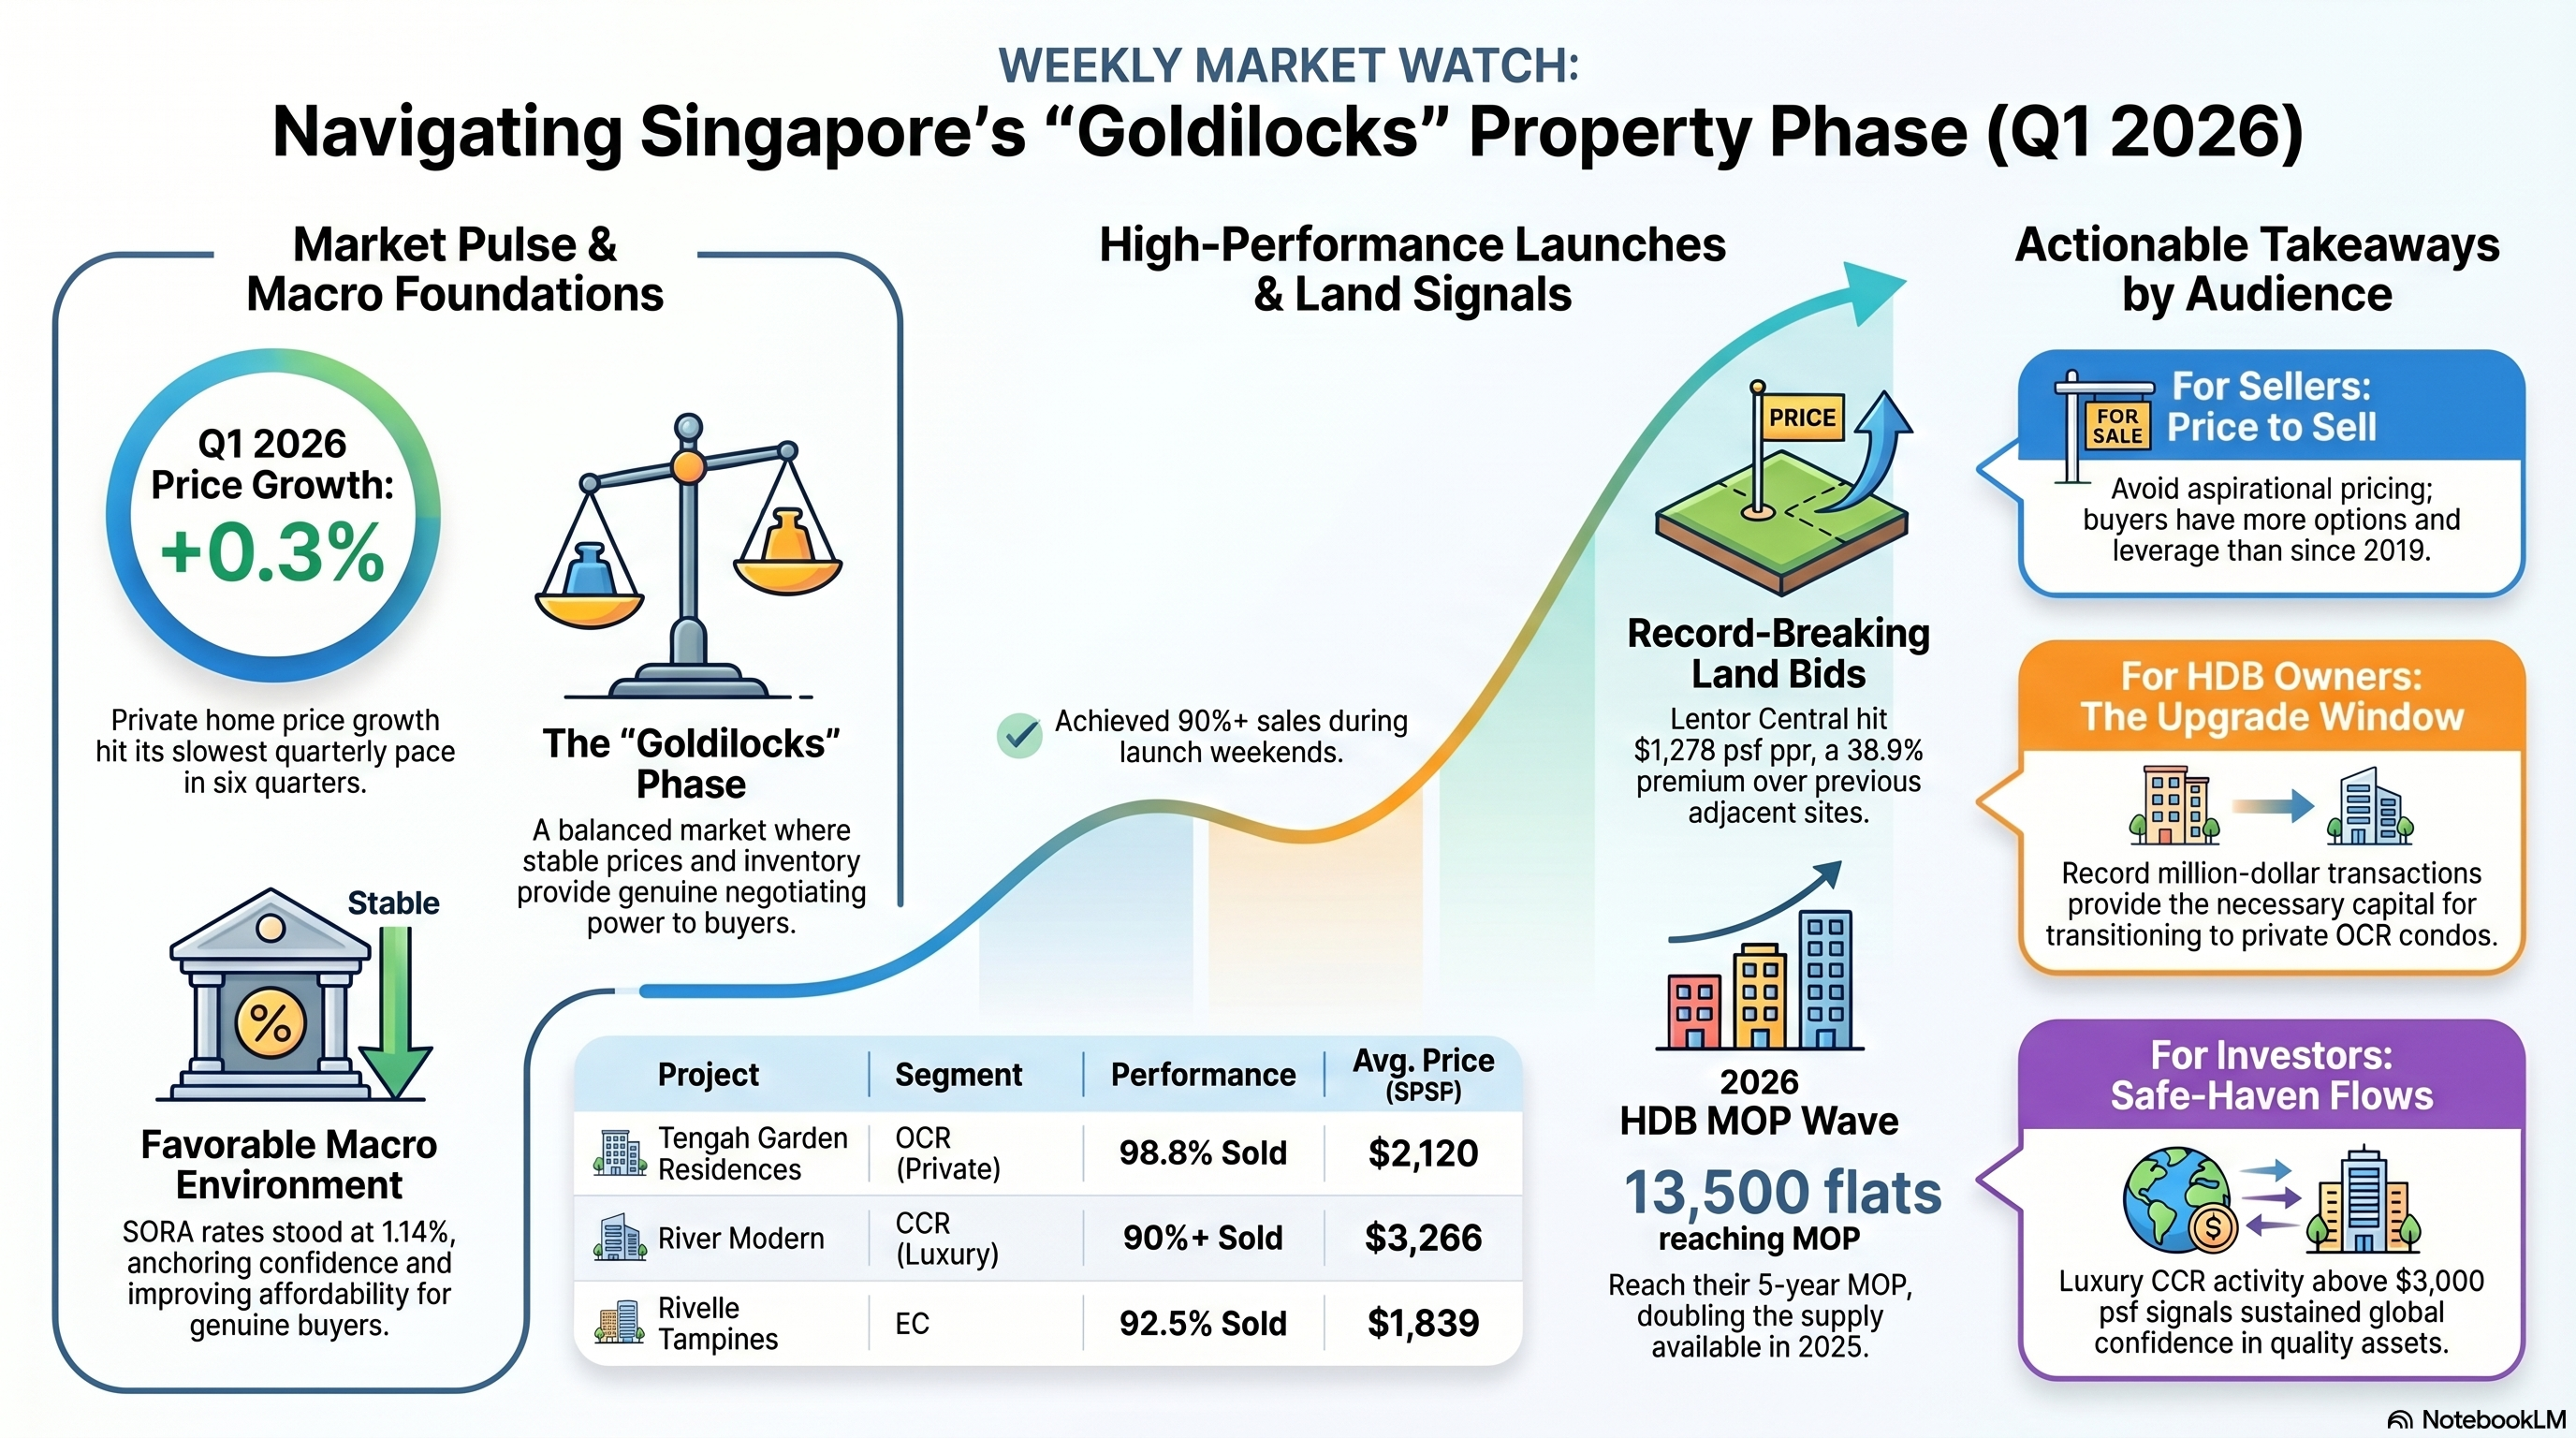
On paper, Q1 2026 makes no sense. Buying activity crashed to its lowest level in years. Yet prices did not follow. The headline private home price growth came in at plus 0.3%, the slowest quarterly pace in six quarters, but still positive. Meanwhile on the same weekend, Tengah Garden Residences sold 98.8% of its 863 units. River Modern in District 9 cleared 90% of 455 units at $3,266 PSF.
This is not a market malfunction. It is a market bifurcation. And understanding which side of the divide your property sits on is the most valuable thing you can know right now.
The Q1 Numbers
Why Prices Are Holding Despite the Volume Collapse
The answer is positive carry. When interest rates drop below the rental yield of a property, the landlord is no longer subsidising the mortgage out of pocket. Rental income covers the debt obligation. That one shift removes desperation from the market entirely.
A seller with positive carry has zero incentive to accept a lowball offer. They can hold indefinitely at no cost to themselves. That dynamic alone establishes a formidable price floor regardless of broader transaction volume or GDP growth projections.
The Demand Barbell
The market has not stalled. It has polarised. Activity has collapsed in the generic middle while both extremes are running hot. I call this the Demand Barbell.
On the left end: accessible OCR new launches and ECs driven by HDB MOP equity. On the right end: ultra-luxury CCR assets above $3,000 PSF driven by global family office capital immune to interest rates. In the middle: generic secondary market condos asking aspirational 2023-era prices that buyers are flatly ignoring.
New Launch Performance Matrix
| Project | Region | Take-up | Avg PSF | Driver |
|---|---|---|---|---|
| Tengah Garden Residences | OCR | 98.8% | $2,120 | 90% Singaporeans, MOP upgraders |
| River Modern | CCR D9 | 90%+ | $3,266 | Direct MRT, riverfront, UHNW capital |
| Vela Bay | RCR D16 | 72% | $2,886 | First Bayshore sea-fronting launch in 26 years |
| Rivelle Tampines EC | OCR D18 | 92.5% | $1,839 | ~20% cheaper than private OCR, strongest EC since 2017 |
The GLS Price Floor Is Already Being Set
The most important forward signal in Q1 2026 is not the transaction data. It is the land bid data.
The Lentor Central GLS site was bid at $1,278 PSF PPR, a 38.9% premium over the adjacent Lentor Gardens site awarded just one year earlier. Tanjong Rhu set a record $1,455 PSF PPR for RCR land. Land costs are rising at approximately 5.5% annually. The new launch supply pipeline is dropping from 11,409 units in 2025 to 8,800 units in 2026.
The HDB Engine Is Powering the Upgrade Wave
13,500 HDB flats reach their 5-year MOP in 2026, double the volume from 2025. Of those, an estimated 5,000 to 6,000 will actively change hands. Each one is a wealth transfer event.
A newly MOP-ed Clementi 4-room flat recently sold for $1.28M, yielding approximately $800,000 in pure profit for the seller. That $800,000 goes directly into the deposit on a $2M-plus private OCR new launch. This is not speculation. This is the mechanical pipeline that cleared Tengah in a single weekend with 90% Singaporean buyers.
Million-dollar HDB flats are no longer anomalies. They have established a structurally higher price floor for the entire Singapore property ecosystem. January 2026 alone saw HDB prices up 1.2% month on month and volume up 15.1%.
What 2026 Rewards vs Punishes
Rewarded
- Precise developer pricing within 5% of bank valuations
- Hyper-prime locations with direct MRT integration
- ECs offering ~20% discount to private OCR
- Large-format freehold CCR with domestic demand anchors
Punished
- Aspirational resale pricing with 2023-era expectations
- Generic aging 99-year leaseholds without walkable amenities
- Oversized layouts breaking TDSR limits for dual-income buyers
- Secondary units priced identically to nearby new launches
The Playbook by Audience
For Sellers
Price to sell, not to test. Buyers have the most options and leverage since 2019. Aspirational pricing results in dead listings. If priced identically to a nearby new launch, buyers will choose the developer every time. Offer a tangible discount or a meaningful point of differentiation. Median seller gains are still $380K - the market is profitable. Secure the gain and exit gracefully.
For Buyers
In the secondary market, you have peak negotiating leverage right now. Sellers facing genuine timeline pressures are highly receptive. But that leverage vanishes completely in a new launch showroom. If you find an efficient layout at a strong location within your budget, hesitation will cost you the unit. The 98.8% Tengah clearance rate proves optimised inventory does not sit idle.
For HDB Upgraders
13,500 flats hitting MOP in 2026 means you are entering alongside the largest cohort of competing sellers in years. Price competitively to secure your upgrade equity before local supply peaks. Target ECs like Rivelle or precisely priced OCR launches keeping your quantum below $2.2M. The BTO policy shift means standard 5-year MOP resale flats now carry a premium worth protecting.
For Investors
Safe-haven capital flows are real and accelerating. Luxury CCR activity above $3,000 PSF signals sustained global confidence in quality assets. The CCR-RCR price gap at its narrowest in 30 years makes freehold D9/D10 assets compelling for long-term safe-haven holds. The EC arbitrage - locked in at a 20% discount to equivalent private condos - remains the most asymmetric bet in the market.
My Take: The Goldilocks Phase
The frenzy of 2021 to 2024 is over. The market has not crashed. It has entered what I call the Goldilocks Phase - not too hot, not too cold, but hyper-selective. Frenzied FOMO buying is dead and volumes are contained. At the same time, massive systemic liquidity from HDB upgrader equity and institutional safe-haven capital prevents price crashes.
Transactions clear when pricing perfectly matches upgrader equity and location utility. Everything else sits on the shelf.
The defining question for 2026 and beyond is not whether prices will rise or fall. It is whether the specific asset you own or plan to buy sits on the right side of the barbell. A unit that is precisely priced, well-located, and anchored to genuine domestic demand will transact. Everything else will wait.
And as land costs continue rising at 5.5% annually with supply dropping to 8,800 units in 2026, waiting has a very specific and measurable cost.
Which Side of the Barbell Is Your Property On?
Whether you are selling, buying, upgrading, or investing, the data is clear on what 2026 rewards and what it punishes. Let's map your specific situation against the numbers.
WhatsApp Keith - +65 9750 1055General information only. Estimates only, not guaranteed, figures may change. Data referenced is based on publicly available market information including URA Q1 2026 flash estimates, HDB resale data, EdgeProp, StackedHomes, and NotebookLM Market Watch W18 analysis at time of publication. Past performance is not indicative of future results. Keith Tan Boon Kee, ERA Realty Network Pte Ltd (CEA Reg. No. R003793E). Always seek independent professional advice before making property decisions.